
Mercator’s Map: The Projection That Shaped How We See the World

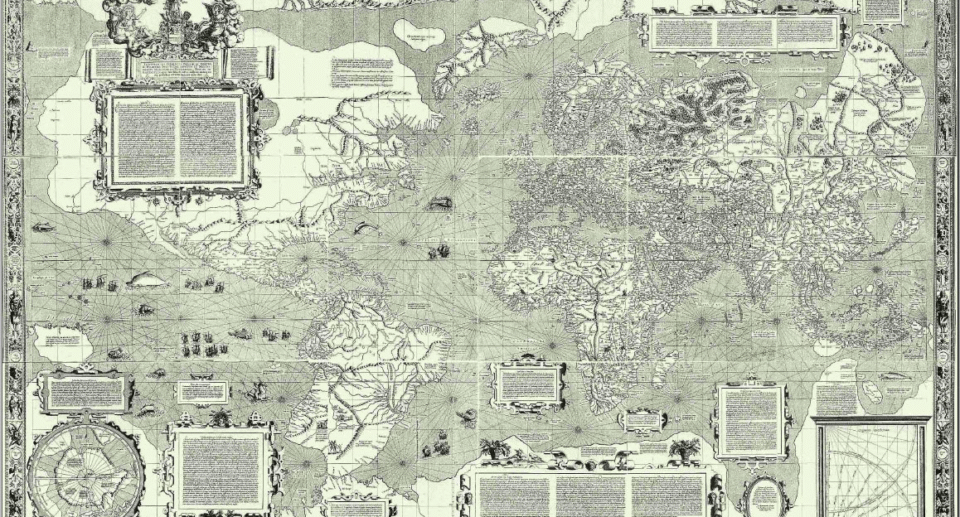
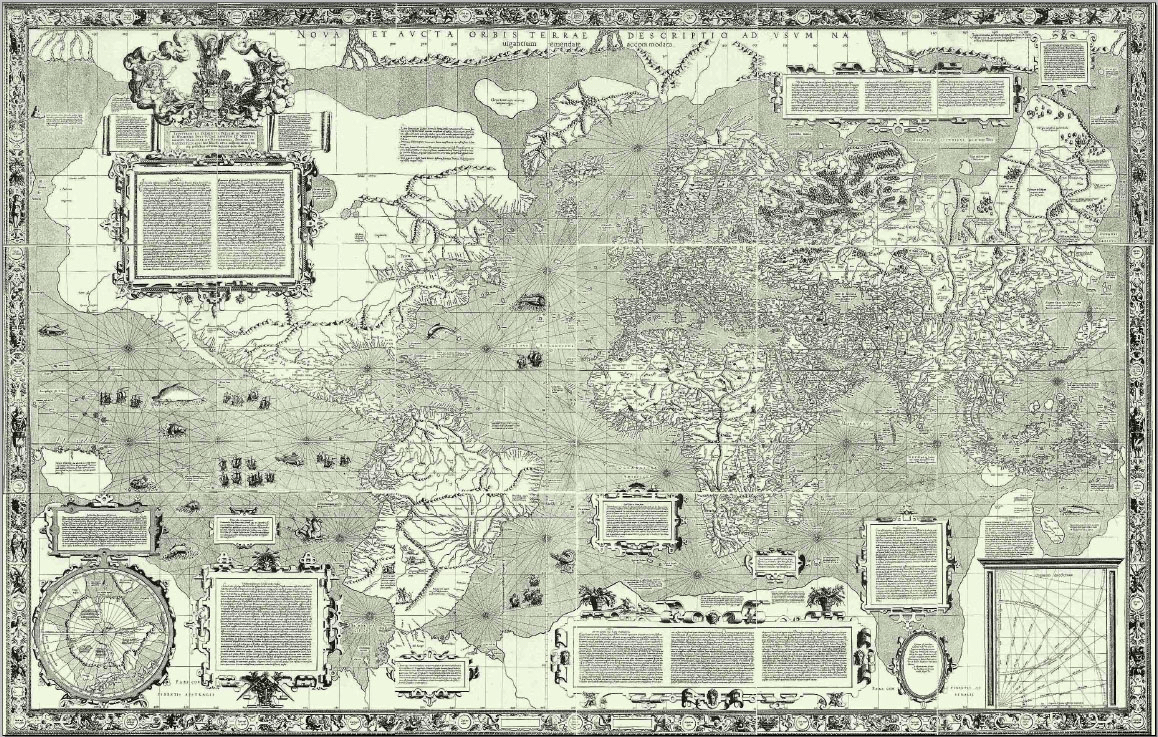
A flat map of a round planet must lie somewhere. The map you probably know best, the one on classroom walls and in your phone, keeps compass directions true but makes places near the poles look huge. Greenland looks as big as Africa, even though Africa is about fourteen times larger. This guide explains why Gerardus Mercator drew his map in 1569, how the stretching works, and what it means for the way we see the world.
| Mapmaker | Gerardus Mercator (1512 to 1594), Flemish |
| Famous map | Nova et aucta orbis terrae descriptio, 1569 |
| Idea | Straight lines of constant compass bearing |
| Cost | Areas near the poles look much too large |
| Used today | Web Mercator in Google Maps and OpenStreetMap |
| Reading time | 10 min read |
The problem every map has
Peel an orange and try to press the skin flat. It will tear or stretch. The surface of a sphere cannot be flattened without distorting something: shape, area, distance or direction. Mapmakers choose which one to keep and which to give up. That choice is called a projection.
Why sailors wanted Mercator’s map
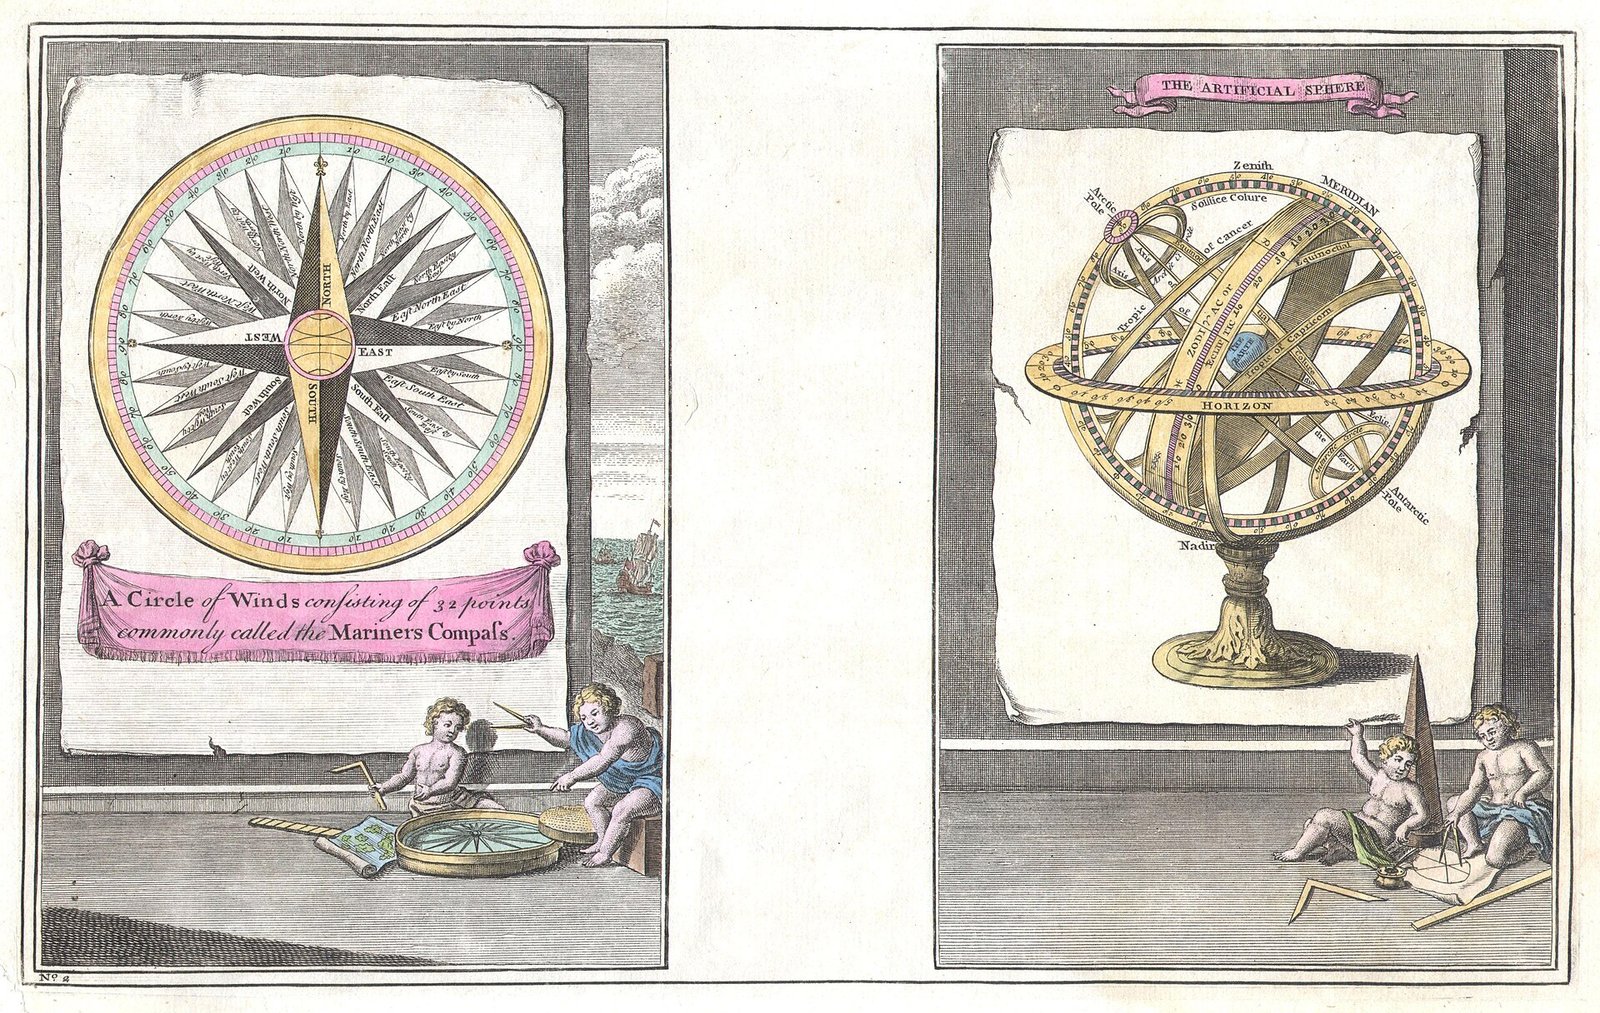
In the 1500s, European ships crossed oceans using a compass. A ship that keeps a steady compass bearing sails along a curve on a globe called a rhumb line. On older flat maps that curve was hard to draw and hard to follow. Mercator found a way to stretch the map so that every rhumb line becomes a straight line. A navigator could now draw a line between two ports, read the angle against the compass rose, and sail that bearing.
The price was area. To keep angles correct, the map stretches east-west and north-south by the same amount at each latitude, and that stretch grows quickly toward the poles. The poles themselves can never be shown, because the stretch becomes infinite.
Try it: how much does the map stretch
Move the slider to a latitude. The circle shows a circle of the same real size drawn on a Mercator map at that latitude. The numbers show how many times larger lengths and areas look.
The maths is short. At latitude φ the stretch in length is 1 divided by cos φ, called secant φ. Area grows by the square of that. Here is the table in Python, with output I actually ran.
import math
for lat in (0, 13, 28, 45, 60, 72, 80, 85):
    p = math.radians(lat)
    y = math.log(math.tan(math.pi/4 + p/2)) + 0.0
    s = 1/math.cos(p)
    print(f"{lat:>3}  y={y:5.2f}  length x{s:5.2f}  area x{s*s:6.1f}")
0 y= 0.00 length x 1.00 area x 1.0
13 y= 0.23 length x 1.03 area x 1.1
28 y= 0.51 length x 1.13 area x 1.3
45 y= 0.88 length x 1.41 area x 2.0
60 y= 1.32 length x 2.00 area x 4.0
72 y= 1.84 length x 3.24 area x 10.5
80 y= 2.44 length x 5.76 area x 33.2
85 y= 3.13 length x11.47 area x 131.6Greenland sits mostly between 60 and 83 degrees north, where areas are exaggerated roughly four to over thirty times. Africa straddles the equator, where stretch is almost nothing. That is why they look alike on the map even though Africa’s real area, about 30.4 million square kilometres, is about fourteen times Greenland’s 2.2 million.
The history of the map
1512: Mercator is born
Gerardus Mercator is born in what is now Belgium and becomes a mapmaker and instrument maker.
1569: The world map for sailors
He publishes a large wall map on 18 sheets with his new projection.
1599: Wright’s tables
The English mathematician Edward Wright publishes tables that explain how to build the projection accurately.
1855: Equal-area ideas
James Gall proposes a projection that keeps areas closer to true. Arno Peters promotes a similar map in the 1970s.
2005: Web maps
Online map services adopt a version of Mercator called Web Mercator for their zoomable maps.
Mercator also gave us the word atlas for a book of maps. His son Rumold published a collection after his death in 1594. The map for sailors, though, remained his best-known work.
Which projection should you use
| Projection | Keeps true | Gives up | Good for |
|---|---|---|---|
| Mercator | Angles and directions | Area near the poles | Navigation and zoomable web maps |
| Equal-area (Gall-Peters, Mollweide) | Area | Shapes at the edges | Comparing sizes of countries |
| Globe | Almost everything | Cannot be folded in a pocket | The most honest view |
| Natural Earth | A balanced compromise | Nothing exactly right | World wall maps |
Our Maps Lab shows the world with a compromise projection, and a 3D globe you can spin, so you can compare the sizes of countries with the Mercator view. Try it in the world map tab.
India and the mapping of the subcontinent
Mapping India was one of the largest scientific projects of the 19th century. The Great Trigonometrical Survey began in 1802 under William Lambton, using a chain of precise triangles measured across the land. Later George Everest led it, and Indian surveyors such as Radhanath Sikdar did the maths and fieldwork. Sikdar is credited with recognising that Peak XV was the highest mountain in the world, a result announced in 1856. The mountain was later named after Everest.
On a Mercator map India sits near the equator, so it is only mildly stretched: Chennai is about 3 percent longer in length, and Delhi about 14 percent. Himalayan ranges around 35 degrees north are stretched more, about 22 percent in length. Today the Survey of India issues official maps, and maps published in India must follow its outer boundary.
Mind map: maps and projections
- Mercator map
- Problem
- Sphere to flat
- Orange peel
- Something must give
- Mercator idea
- Rhumb lines straight
- Angles true
- Poles stretched
- Distortion
- Length: sec lat
- Area: sec squared
- Greenland vs Africa
- History
- 1569 world map
- Wright 1599 tables
- Web Mercator 2005
- India
- Great Trigonometric Survey: 1802
- Radhanath Sikdar
- Mount Everest: 1856
- Survey of India
- Problem
Myths worth correcting
- Myth: Mercator wanted to make Europe look big. Fact: he designed it for navigation. The side effect on size was a known cost.
- Myth: The Mercator map is wrong. Fact: it is correct for angles. It is just not the right tool for comparing area.
- Myth: Equal-area maps are always better. Fact: they distort shapes, so each map suits a job.
Key takeaways
- Every flat map of the Earth distorts something.
- Mercator kept angles true so that a compass bearing is a straight line.
- The stretch in length is 1/cos(latitude) and the stretch in area is its square.
- Greenland looks as large as Africa on this map, but Africa is about 14 times bigger.
- India is near the equator, so Mercator distorts it only mildly.
Frequently asked questions
Why do web maps still use Mercator?
Because angles stay true when you zoom in, so streets keep their shape and compass directions stay correct locally.
Why can I not see the poles on Google Maps?
On a Mercator map the poles stretch to infinity, so web maps cut off near 85 degrees.
Is there a perfect map?
No. A globe is the only way to show everything correctly, and it cannot be unrolled flat.
How big is Greenland really?
About 2.2 million square kilometres, roughly the size of Saudi Arabia, not Africa.
Keep reading
The instrument that made Mercator’s map useful.Riding the Monsoon
How sailors used the winds of the Indian Ocean.Maps Lab
Our interactive India map, world map and 3D globe.Mind Map hub
See navigation in the bigger picture.
Sources
- Mercator projection, Encyclopaedia Britannica, overview of the projection
- Gerardus Mercator, Encyclopaedia Britannica, life and the 1569 map
- Great Trigonometrical Survey, Britannica, survey of India
- Radhanath Sikdar, Wikipedia, Peak XV calculation
Facts were cross-checked against these pages and rewritten in our own words. Stretch figures are calculated from the standard formulas.

1 Comment
[…] CompassThe instrument that helped sailors find their way.Mercator’s MapA map made for sailors.The Invention of FarmingHow rain and rivers shaped farming.Maps LabExplore India, the world and a 3D […]